Have you recently moved away from Linode to any other VPS (Virtual Private Server) providers for hosting your web server? Are you still desperately looking for an alternative to Linode server monitoring tool LongView?
Yes….
Ok, I am here to guide you in fixing the web server monitoring issues.
I have hosted this blog in Linode for more than two years and their services impressed me a lot. The free server monitoring tool LongView has amazed me with its simplicity. It was very simple to configure and easy to use with an awesome GUI. Linode is still allowing their customer to access old management portal may be due to LongView.
I started this blog on 110mb.com but when they have decided to drop their hosting service, I moved my blog to GoDaddy. I have hosted there for many years till the introduction of LightSail by AWS. I moved there with basic $5 plan, but it didn’t last long with limited 512 MB RAM on VPS. I was experiencing frequent outage on AWS LightSail. While looking for an alternate solution, I found that Linode was offering 1 GB RAM under $5 plan. Since, I don’t have huge traffic in my blog, I have decided to move to Linode for which I never regret. I have hosted my blog in Linode for more than two years without any issues. To catchup with Linode and other similar VPS providers, AWS decided to offer even more under $5 plan, but I didn’t move back immediately. I finally decided to move to AWS LightSail again as my blog (WordPress) was no longer getting any update because of older version of PHP installed on my VPS. So far it was a smooth transition till I realized that there is no LongView in AWS for monitoring my blog performance.
![]()
I was desperately looking for a solution and fortunately I came across one of the community posts in Linode community, where I saw a response form kmansoft, which was very interesting. So, I decided to dig deeper and I found that kmansoft is working on a similar project that seems very similar to LongView and he named it ClearView. You don’t have to do any complex configuration on your server, you just have to install the latest available binary (zero dependency) depending on which operating system you are running on and after installing you just have to link it with your client id. It will start sending the data to the ClearView and you will get you web server monitoring system up and running in just few minutes. You can avail their android application with which you can monitor your website performance on the go.
With ClearView, you will be able to monitor following components.
- CPU
- Processes
- Memory
- System
- Load
- Disk
- Disk IO
- Network
- Apache (Optional)
- Nginx (Optional)
- MySQL (Optional)
- PgSQL (Optional)
Application Details:
Author : Kostya Vasilyev
Web Site : https://clearview.rocks/
Demo : https://demo.clearview.rocks/web/charts-index.html
Registration : https://clearview.rocks/web/charts-index.html
Android App : https://play.google.com/store/apps/details?id=org.kman.clearview
Client Download : https://clearview.rocks/install.html
Installation:
First you must download the client application on your server depending on which operating system you are running. I am running x64 so, I have downloaded AMD64 version
![]()
After downloading, you have to install it using sudo dpkg -i clearview-agent_XXXX_XXXX.deb.
![]()
Once you installed, you have go to ClearView Console and add a client. Here on the popup windows, you have to note down the account_id and node_id, which you have to add in the ClearView configuration file (/etc/clearview.conf).
![]()
Now, again go to your ssh console, and edit the ClearView configuration file (/etc/clearview.conf) using your favorite CLI editor. You have add the account_id and node_id here which you have copied in previous step. You can also configure your MySQL database and apache/nginx using this, but it is optional.
![]()
Once you updated the configuration file (/etc/clearview.conf), you have to enable the ClearView service for the very first time using sudo systemctl enable clearview-agent, and after that you have to
start the service using sudo systemctl restart clearview-agent. Form now on every time you update the configuration file (/etc/clearview.conf), you must restart the service by using sudo systemctl restart clearview-agent.
![]()
Once you restart service, I would suggest you run this immediately to check the service start status journalctl -f -u clearview-agent
Once everything complete, you will start getting the data in ClearView Console.
![]()
Once select you client, you will get the overview
![]()
Next, you will get the network monitoring.
![]()
Next will be Disk monitoring.
![]()
After Disk, it will be Process Monitoring
![]()
Optionally, you can also enable Apache Monitoring.
![]()
similarly, you can also enable MySQL Monitoring.
![]()
Finally, you will get the overall system information.
![]()
ClearView also have one android application which is very easy to use and really helpful for checking the server performance on the go. ClearView currently in preview state and soon it will be available commercially. You can go ahead and get your own account for free to configure your web servers as early adaptors. Author of this project Kostya Vasilyev also promised that all the early adaptors will be able to use the service for free when the application will be available commercially. So, I would suggest, do not wait too long
Create Private PPTP VPN for personal use in Linode Cloud Hosting.
Nowadays many things are getting blocked by the government, and sometimes without…
Do not trust any public VPN service, Create your own Secure SOCKS5 Proxy for just $5 – Be Free 🙂
If someone ask me to recommend one good proxy service, I would…
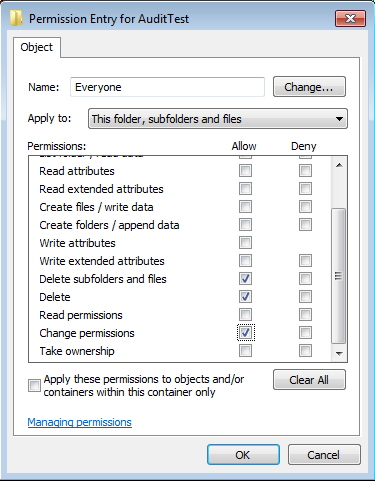
Set File System Auditing via PowerShell
For last few days, I was trying to figure out how to…
The Ultimate Command Center for AdGuard Home Power Users
The Problem: "Friction & Context Switching" Whether you run a single AdGuard…